A three week academic project focused on interaction design completed in June 2020.
interaction design, research, wireframing, visual design
Figma, Adobe Illustrator
Alexander Lockhart, Serena Ho
Citymapper is a transit-focused navigation application that improves travel experiences by using data-driven solutions to provide accurate information and to consolidate the most efficient multimodal route options. The company intends to improve urban mobility by humanizing data and simplifying the travel experience. Citymapper is also committed to promoting sustainability and solving fundamental daily problems that improve quality of life.
The goal of this project is to design a feature that does not currently exist on the Citymapper platform. By taking into account the habits of their users and the data available to the company, the feature we create can improve the experience of daily commuters.
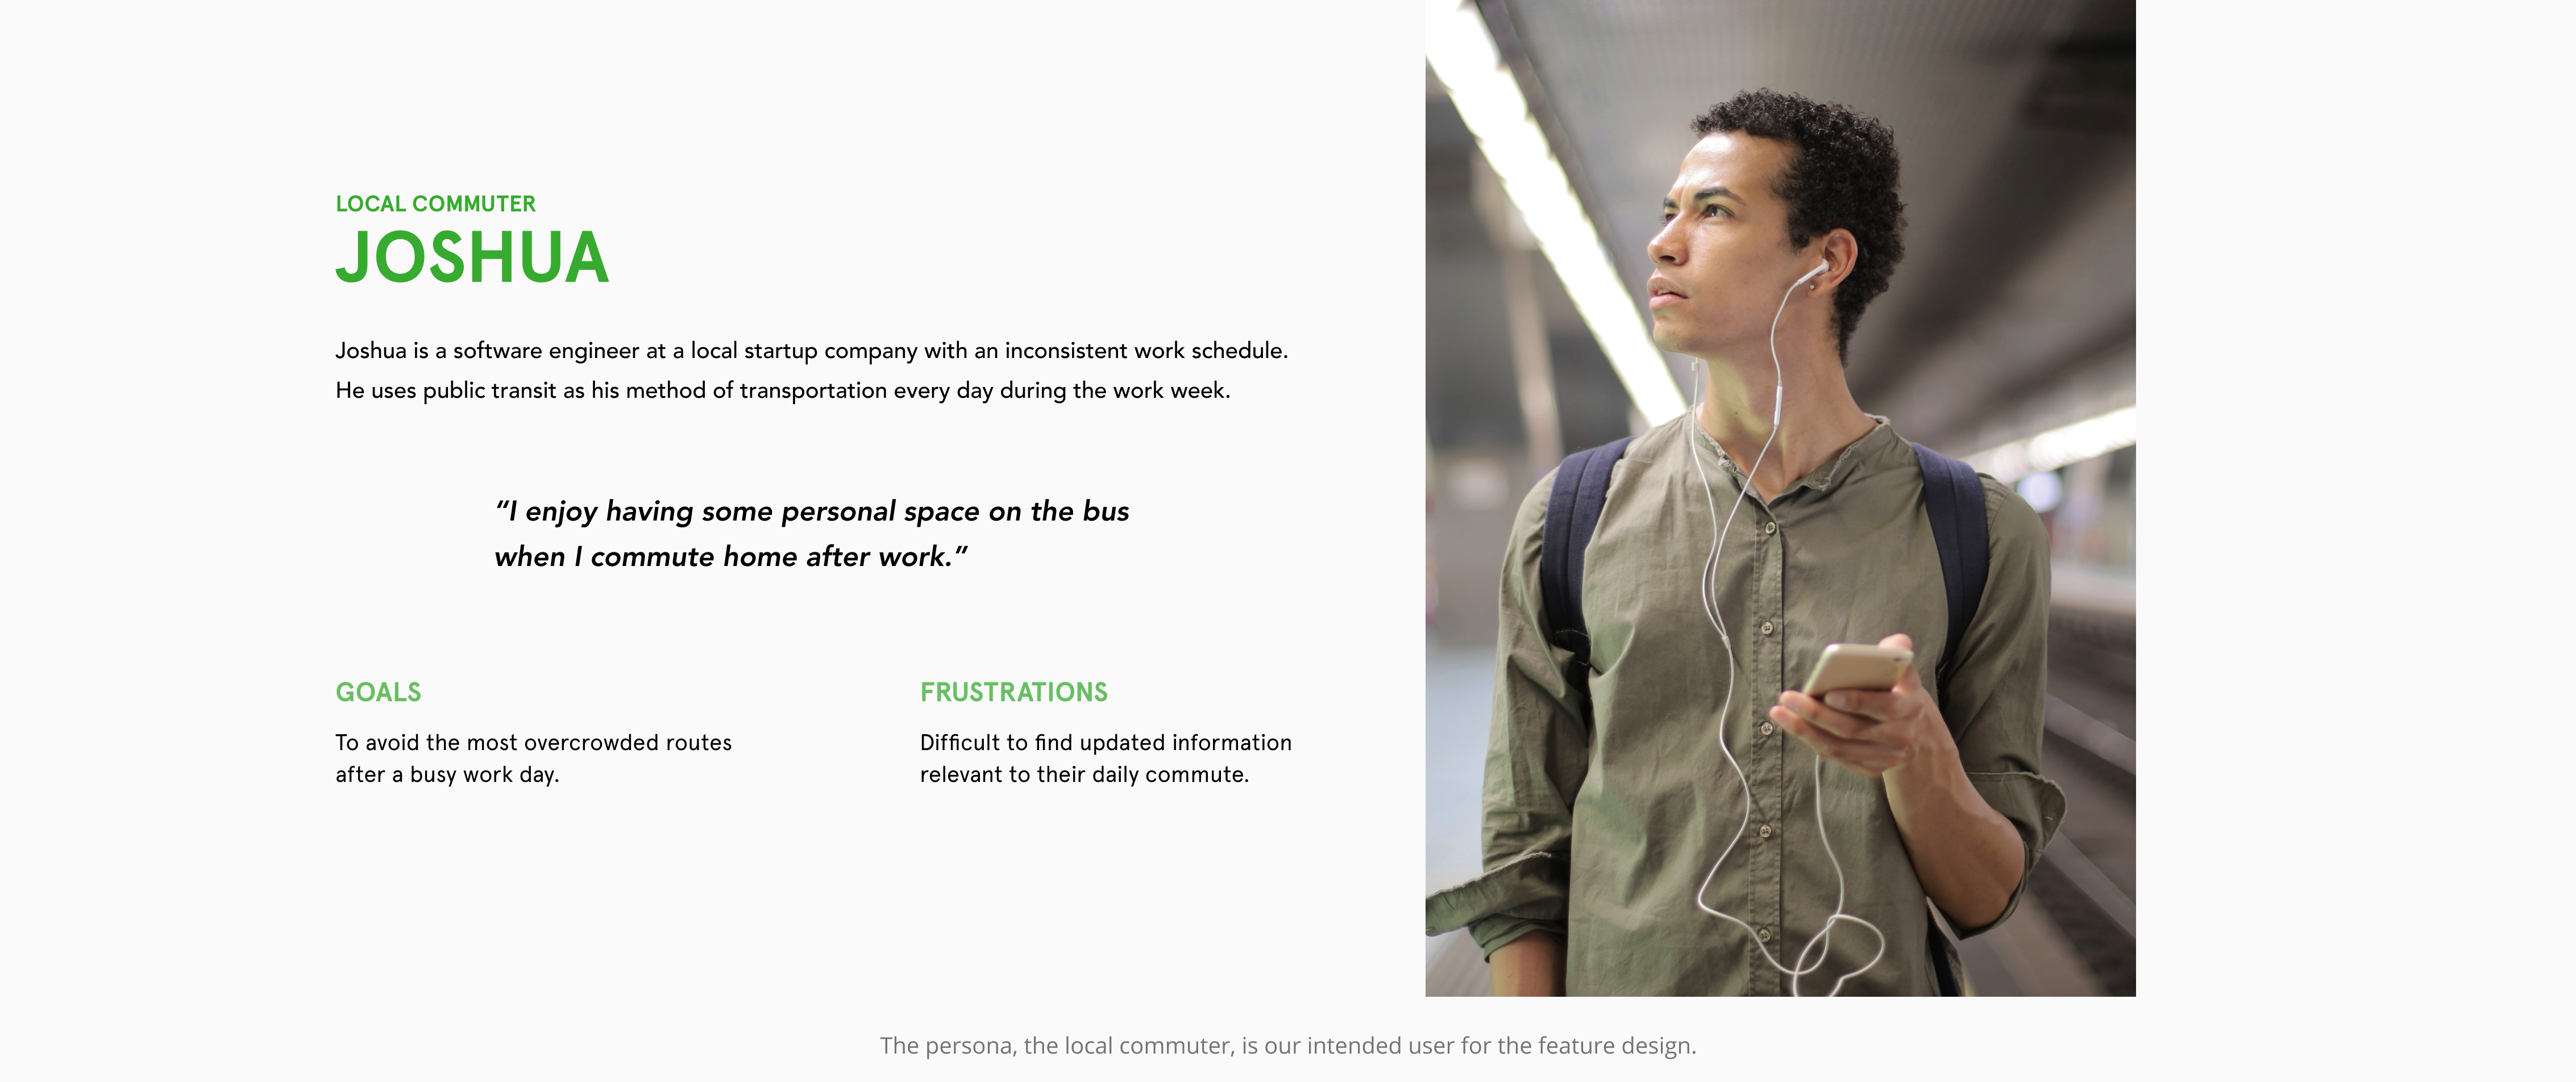
With initial research into Citymapper, we identified local commuters as Citymapper's primary users and tourists as secondary users. Whereas commuters were more concerned with timing with transit services, tourists used the applicaiton for wayfinding purposes. With this in mind, we found other applications that were also common within this demographic, including Google Maps and Transit.
The team and I completed remote interviews with transit users to grasp the transit navigation app market locally and as tourists, as well as the strengths and weaknesses of Citymapper. The interview was separated into three phases:
While many participants prided Citymapper on the large amount of features and information provided by the application, many found the interface to be visually overwhelming. Nearly all participants were also unable to comprehend the complex datasets that were presented to them. In addition to feedback on Citymapper's interface, participants' commute habits were also discussed. They each had differing opinions on what the 'ideal' route is, but many placed comfort and less populated routes of higher importance than a faster route.

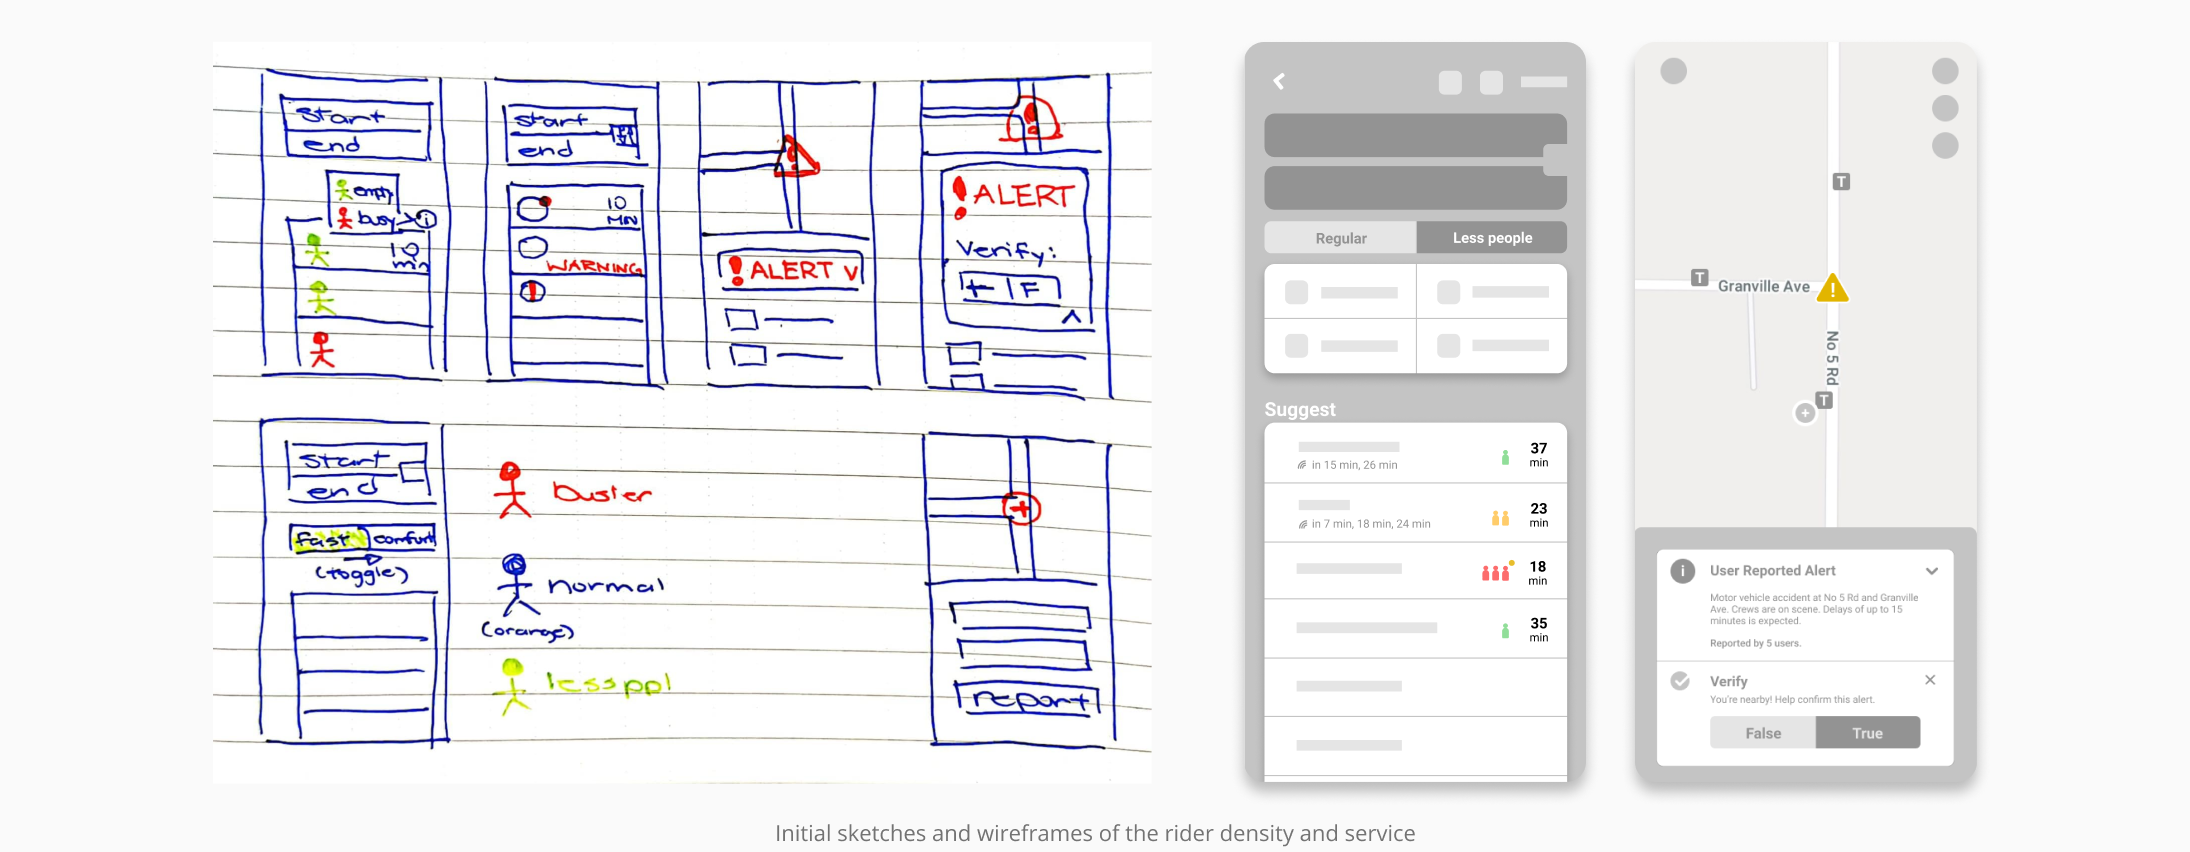
As we brainstormed potential solutions for the issues that users may face, we landed on three potential features we could introduce to the Citymapper platform: rider density data, service delay alerts, and a safe travel mode. I created sketches and wireframes for both rider density and service delays. However, of the three concepts, only the rider density idea was implemented into our final mockups.

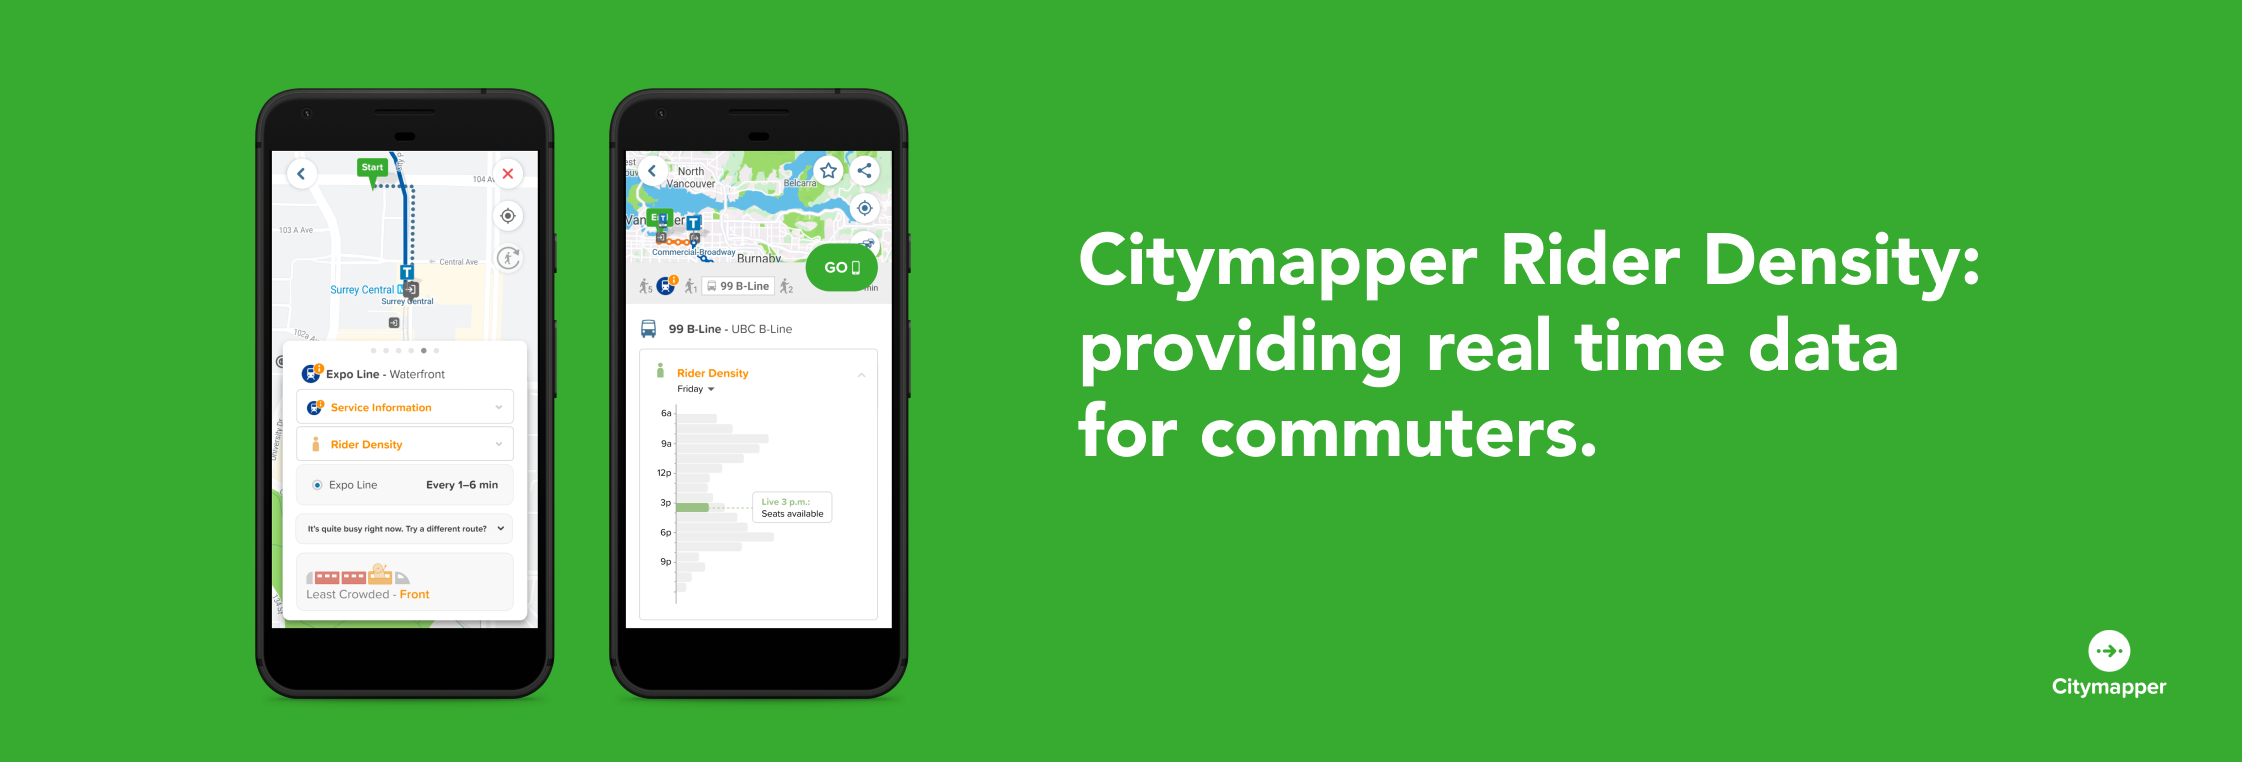
Our feature informs the user when a transit line or route is in high-use. Users can use this tool to understand upcoming transportation density and determine the best route option to take.
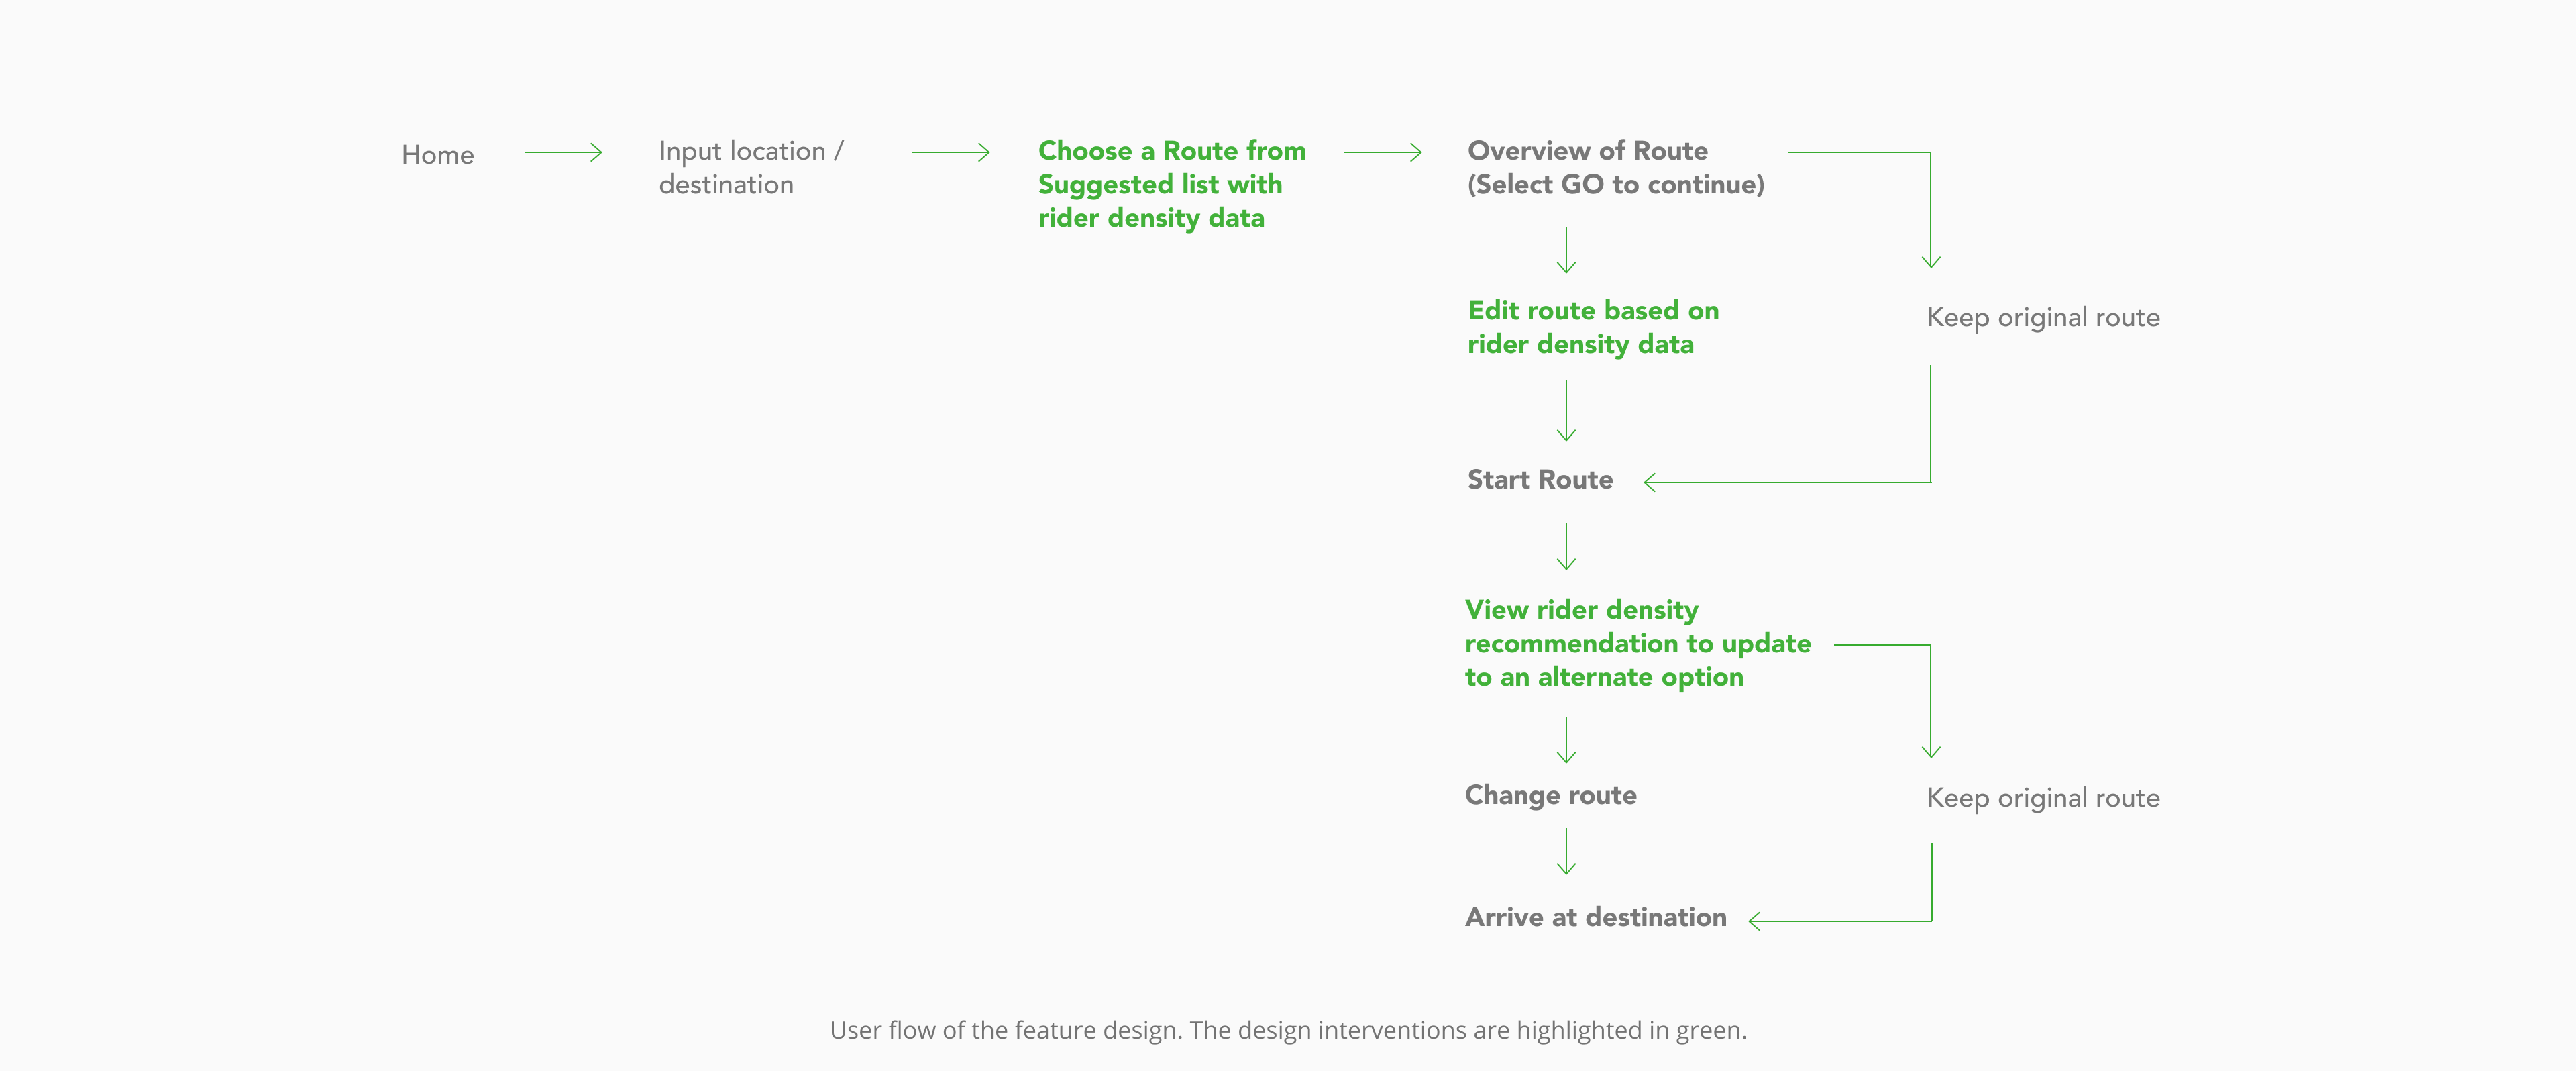
Throughout their trip, users are given multiples chances to select their ideal route or alter their current one. In the beginning, they may choose a route depending on their preferences, whether that may be speed, least transfers, or rider density. When they encounter a route with high-demand, they are given the opportunity to change to an alternate route that has lower ridership.

When conducting our research with participants, most did not understand the complex datasets presented to them. We aimed to simplify data into easily understood visuals.

Citymapper's existing interface were incorporated into our mockups. We initially worked with low fidelity wireframes and later completed a prototype that demonstrates our implemented feature.
When commuters are selecting their route, they are given information about the ridership prior to their selection. Additionally, Citymapper's train icon displays density data in each car and a schedule displays times of highest and lowest rider density. By incorporating this into Citymapper's existing interface, users can make an informed decision before commencing their trip.
Even after commencing the trip, users can view route density data. During times of high rider density, they are given the opportunity to choose an alternate mode of transport that has lower ridership or revert to their orginal choice. Users are free to switch between the routes at any time.
While Citymapper already has data regarding transit usage, users may be prompted to rate ridership levels at the end of their trip for less populated areas. This ensures that rider density is kept accurate in areas where Citymapper is not used as frequently.
This academic project really introduced me to the world of interface design and the importance of getting user feedback prior to starting any brainstorming session. The research phase and conducting usability tests on Citymapper's existing app helped us examine issues in the interface that we as designers may not notice. By getting the mindset of both daily commuters and tourists allowed me to see the project with different perspectives and find what Citymapper's users need to improve their experience.